If you’ve just entered the world of trading, you’ve likely heard about Fibonacci retracement—but what exactly is it, and why is it so widely used? In this guide, we’ll explain what Fibonacci retracement is, how it works, and why traders rely on it to identify market turning points.
What Is Fibonacci Retracement?
Fibonacci retracement is a popular technical analysis tool used to identify potential support and resistance levels based on the Fibonacci sequence. Traders apply it to a price chart to forecast where the market might pause or reverse during a pullback or correction.
Who Developed Fibonacci Retracement?
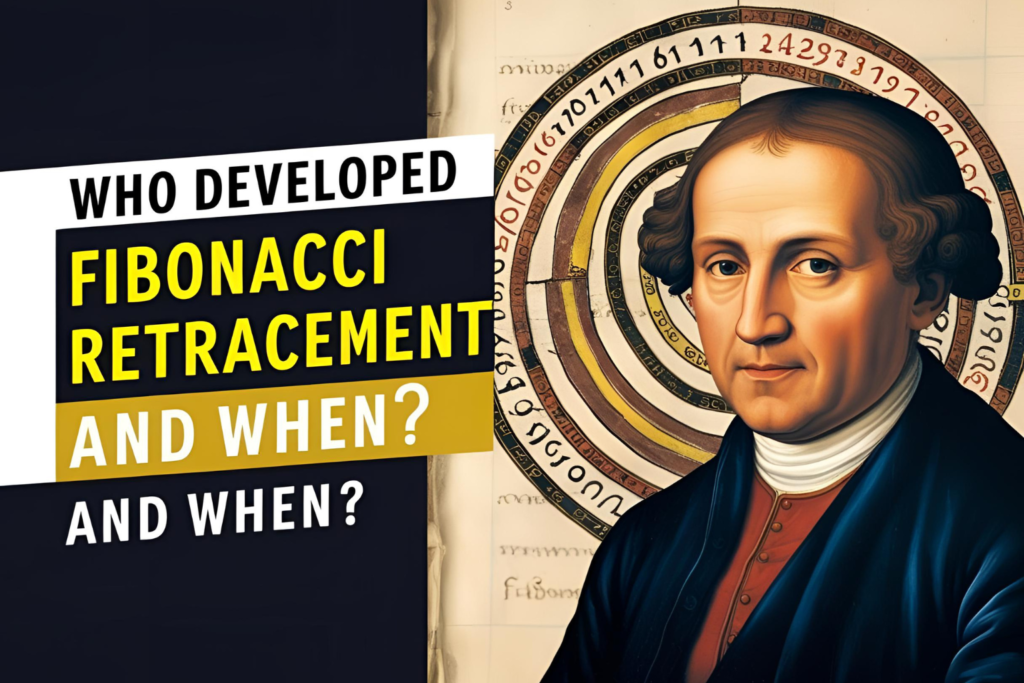
The concept is based on the Fibonacci sequence, introduced by Italian mathematician Leonardo Fibonacci in the 13th century. The retracement levels used in trading are derived from the ratios between the numbers in the sequence—notably 0.236, 0.382, 0.500, 0.618, and 0.786.
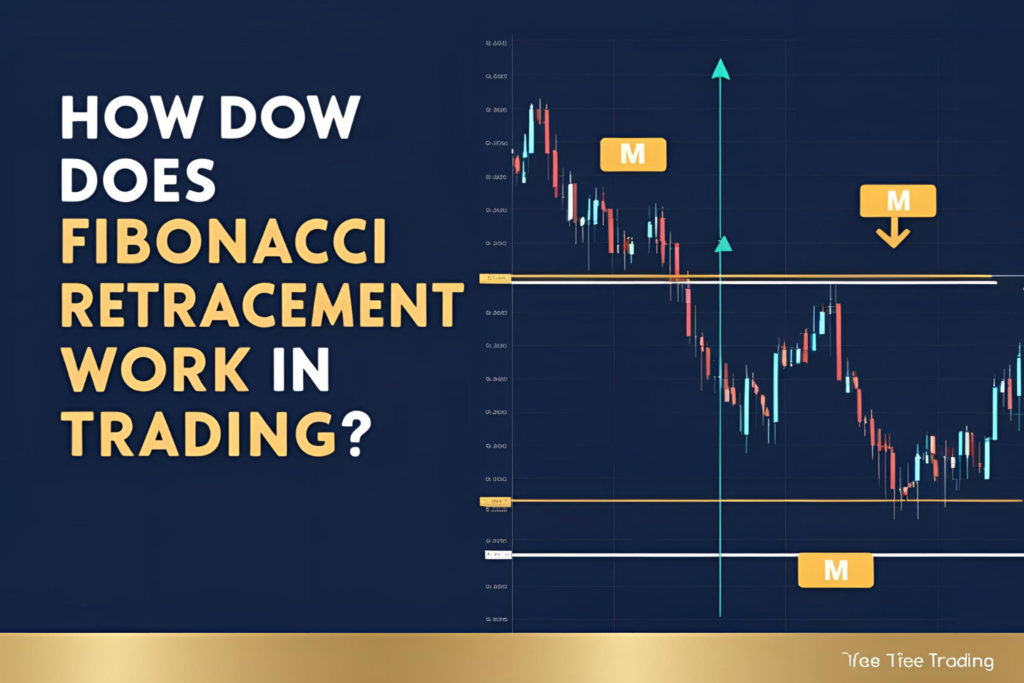
How Does It Work in Trading?
Traders draw a Fibonacci retracement tool from a recent high to low (or vice versa). The resulting horizontal lines—plotted at the key Fibonacci ratios—represent potential price levels where the market may find support or resistance.
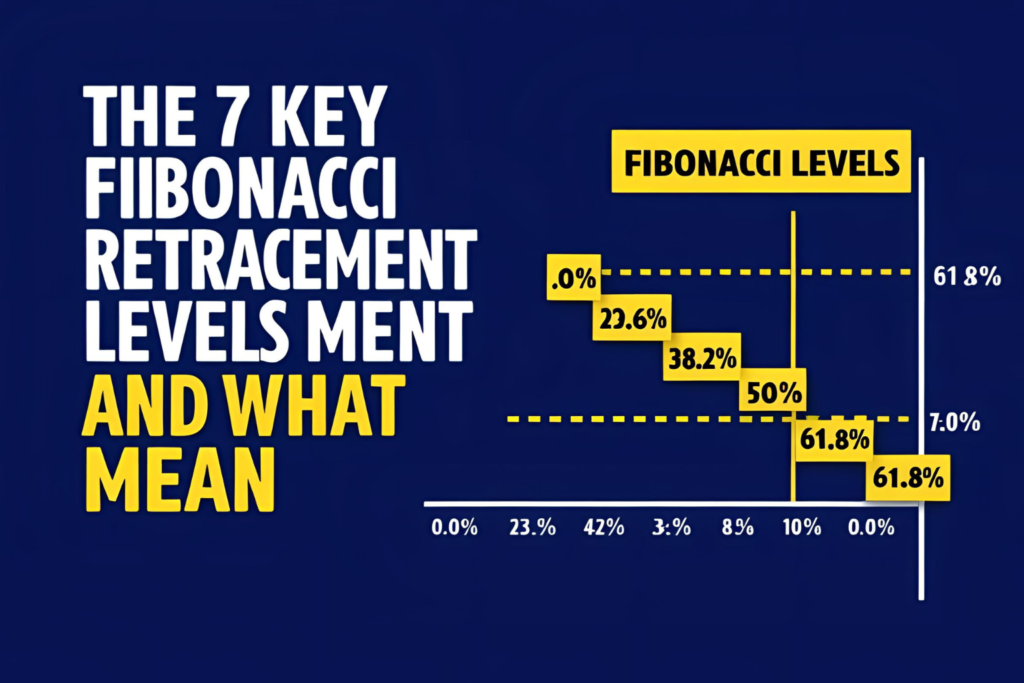
Common Fibonacci Retracement Levels
The most commonly used retracement levels are:
- 23.6% – Shallow pullback
- 38.2% – Moderate retracement
- 50.0% – Psychological midpoint (not an official Fibonacci number)
- 61.8% – The Golden Ratio
- 78.6% – Deep retracement
These levels help traders plan entries, exits, or stop-loss placements.
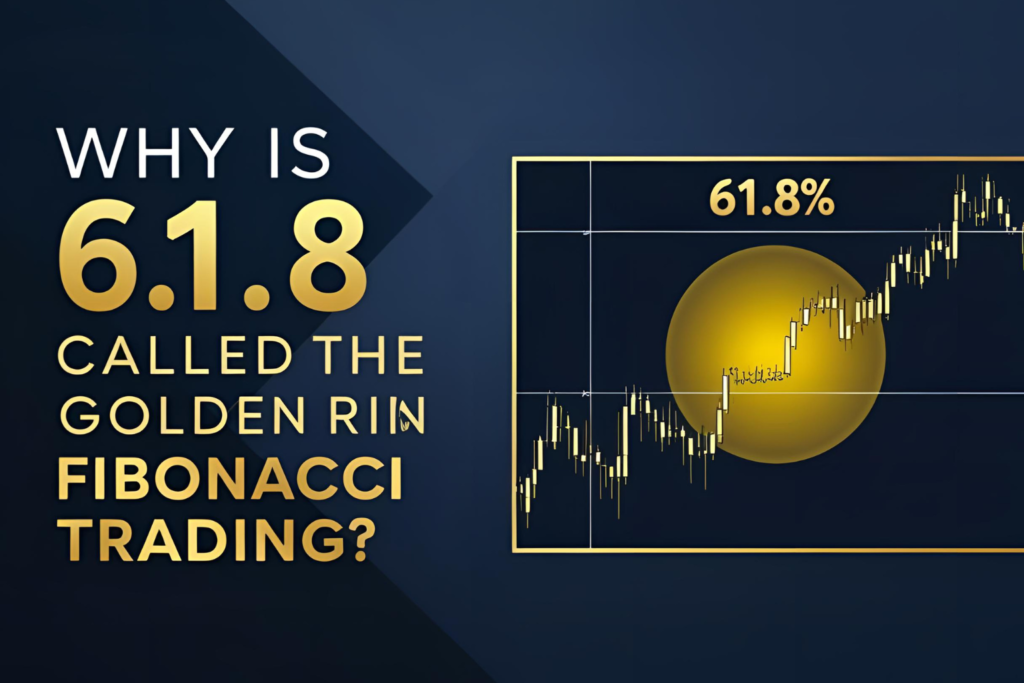
Why Is 61.8 Considered the Golden Ratio?
The 61.8% level is known as the golden ratio because it appears frequently in nature, architecture, and mathematics. In trading, this level is often considered a key reversal zone, where strong price reactions can occur.
Practical Example
Suppose a stock moves from $100 to $150. Drawing a Fibonacci retracement from the swing low ($100) to the swing high ($150) gives you:
- 38.2% retracement = $130.90
- 50.0% retracement = $125.00
- 61.8% retracement = $119.10
These are areas where price may pull back before resuming the trend.
Final Thoughts
Now that you understand what Fibonacci retracement is, you can see why it’s one of the most respected tools in technical analysis. It doesn’t predict direction but offers key levels to anticipate potential turning points in the market.
As you continue learning, try applying it on charts across stocks, forex, or crypto—and see how often price reacts around these Fibonacci levels.
✅ FAQs
1. What is the main purpose of Fibonacci retracement?
To identify potential levels where price may pause or reverse during a trend.
2. Why is 0.618 important in Fibonacci retracement?
It’s called the golden ratio and is believed to be a strong level of support or resistance.
3. Is Fibonacci retracement useful for beginners?
Yes, it’s one of the simplest and most visual tools for technical analysis.
4. How are Fibonacci levels calculated?
They are derived from ratios between numbers in the Fibonacci sequence.
5. Does Fibonacci retracement work in all markets?
Yes. It’s widely used in stocks, forex, crypto, and commodities.