Fibonacci retracement levels are used by traders to identify possible support and resistance zones during pullbacks. These levels are derived from the famous Fibonacci sequence and play a critical role in technical analysis across all financial markets.
In this post, we’ll break down the 7 key Fibonacci retracement levels, what they mean, and how traders use them effectively.
What Are Fibonacci Retracement Levels?
Fibonacci levels are percentages based on mathematical ratios that occur naturally. When applied to price charts, these percentages highlight potential areas where price may pause, bounce, or reverse during a trend correction.
✅ The 7 Key Fibonacci Retracement Levels
| Level | Value | What It Suggests |
|---|---|---|
| 0.0% | Start of the move | No retracement; trend continuation |
| 23.6% | Shallow pullback | Minor retracement; trend is strong |
| 38.2% | Moderate pullback | Often used as early support/resistance |
| 50.0% | Midpoint (psychological) | Common reversal area, despite not being an official Fibonacci number |
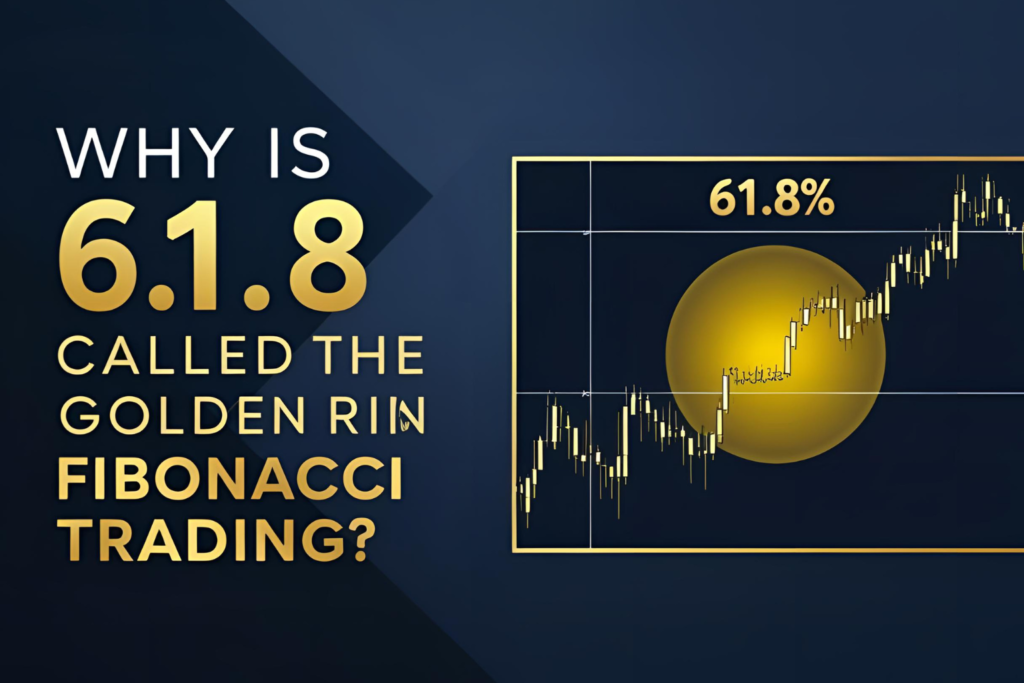
| 61.8% | The Golden Ratio | Strong reversal zone; highly watched by traders |
| 78.6% | Deep retracement | Final support/resistance before full reversal |
| 100% | Full retracement | Entire trend move is canceled or reversed |
✅ Visualizing the Levels in a Chart
Suppose a stock moves from $100 to $150:
- 23.6% retracement: $138.20
- 38.2% retracement: $130.90
- 50.0% retracement: $125.00
- 61.8% retracement: $119.10
- 78.6% retracement: $110.70
These levels become horizontal support/resistance zones used to manage entries, exits, or stop-losses.
✅ How Traders Use These Levels
- Entry Points: Buy near support levels (e.g., 38.2%, 61.8%)
- Stop-Loss Zones: Set stops just beyond deeper levels (e.g., below 78.6%)
- Profit Targets: Use previous levels as exit points
- Trend Confirmation: Retracements within 38.2–61.8% often signal trend continuation
Why Are These Levels So Important?
- Many traders and algorithms monitor them, making reactions more likely
- They reflect natural mathematical proportions
- Applicable to stocks, forex, crypto, and commodities
Final Thoughts
Knowing the Fibonacci retracement levels helps you trade with structure. From shallow pullbacks to deep retracements, each level serves a purpose in identifying where price might reverse or continue. As with all tools, combine them with price action, volume, or momentum indicators for best results.
✅ FAQs
1. Which Fibonacci retracement level is most accurate?
The 61.8% level is the most respected, often called the “golden ratio.”
2. Is the 50% level part of the Fibonacci sequence?
No, but it’s widely used due to its psychological significance.
3. What if price breaks all Fibonacci levels?
It could mean a trend reversal or strong counter-trend move is underway.
4. Do Fibonacci levels work in all markets?
Yes, they are effective in stocks, forex, crypto, and indices.
5. Should I use all 7 levels in my chart?
Use the ones most relevant to your strategy—commonly 38.2%, 50%, and 61.8%.


