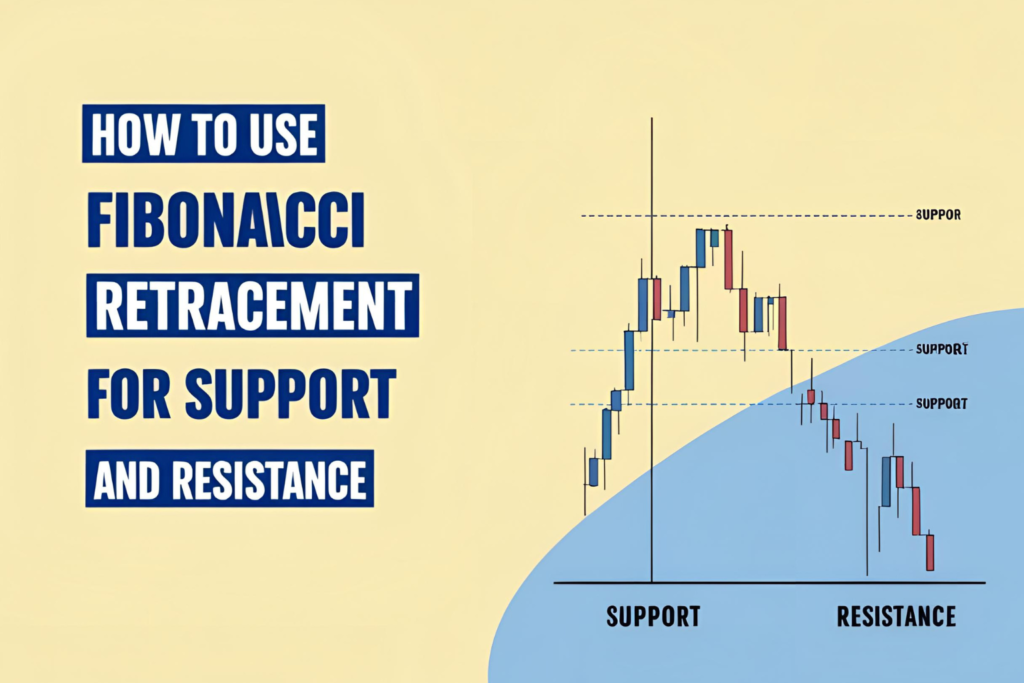
Fibonacci retracement is one of the most powerful tools for identifying key support and resistance levels. But to get consistent results, traders need to know how to use Fibonacci retracement effectively—not just where to draw lines.
In this guide, you’ll learn practical strategies and tips to get the most out of this essential indicator.
Step 1: Identify a Strong Price Move
Before applying Fibonacci retracement, spot a clear impulse move on your chart—either upward or downward. This move should be:
- Clean and directional
- Recent enough to reflect current market sentiment
- Have a clear swing high and swing low
Step 2: Draw the Fibonacci Tool Correctly
- In an uptrend: draw from the swing low to swing high
- In a downtrend: draw from the swing high to swing low
This will create horizontal retracement levels at 23.6%, 38.2%, 50%, 61.8%, and 78.6%.
Step 3: Watch for Price Reaction at Key Levels
The most commonly used retracement levels are:
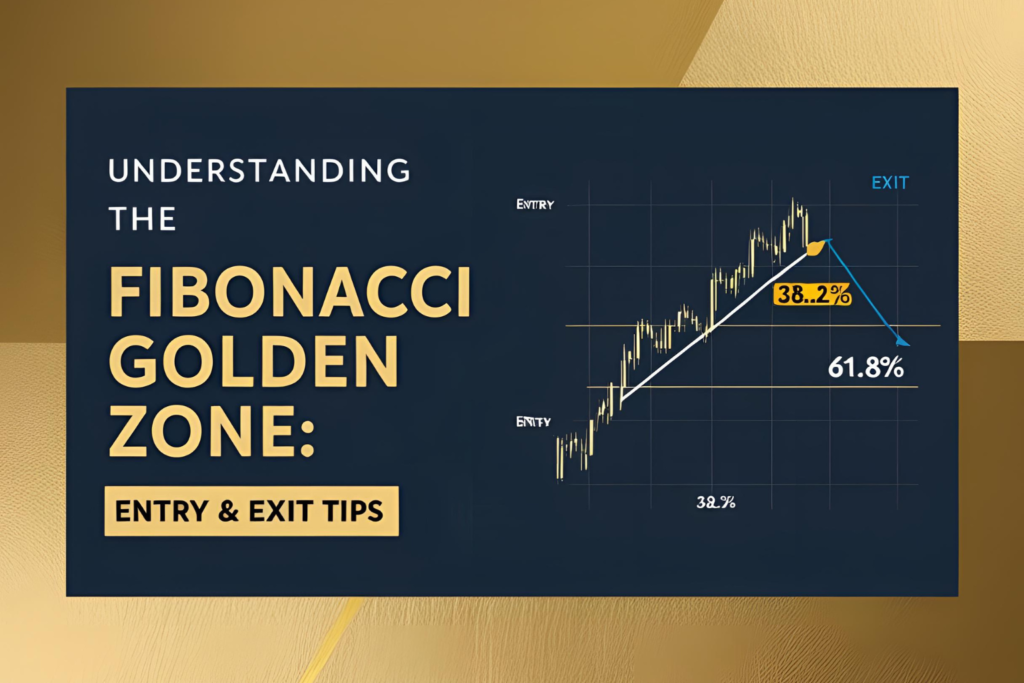
- 38.2% – early bounce zone
- 50% – psychological midpoint
- 61.8% – the golden ratio, high-probability reversal area
Look for rejection candles, volume spikes, or momentum shifts at these levels for confirmation.
Step 4: Combine with Confirmation Tools
Fibonacci retracement works best when combined with other tools, such as:
- RSI – confirms overbought or oversold conditions
- MACD – confirms trend direction and momentum
- Moving Averages – acts as dynamic support or resistance
- Candlestick patterns – like hammers, engulfing bars, or pin bars
This reduces false signals and improves accuracy.
Step 5: Set Smart Entries, Stops, and Targets
- Entry: Wait for confirmation at or near a Fibonacci level
- Stop-loss: Place just below the next lower level (for longs) or above (for shorts)
- Target: Use recent highs/lows or Fibonacci extension levels like 127.2%, 161.8%
Example: Effective Fibonacci Trade Setup
- Stock rises from $100 to $150
- Price retraces to 61.8% = $119.10
- Bullish hammer appears with increased volume
- RSI moves from oversold back above 30
- Trader enters long at $120, sets stop at $116, targets $145
Bonus Tip: Avoid These Mistakes
❌ Don’t use Fibonacci in flat or choppy markets
❌ Don’t draw it backward (always low to high for uptrends)
❌ Don’t enter blindly—always wait for confirmation
Final Thoughts
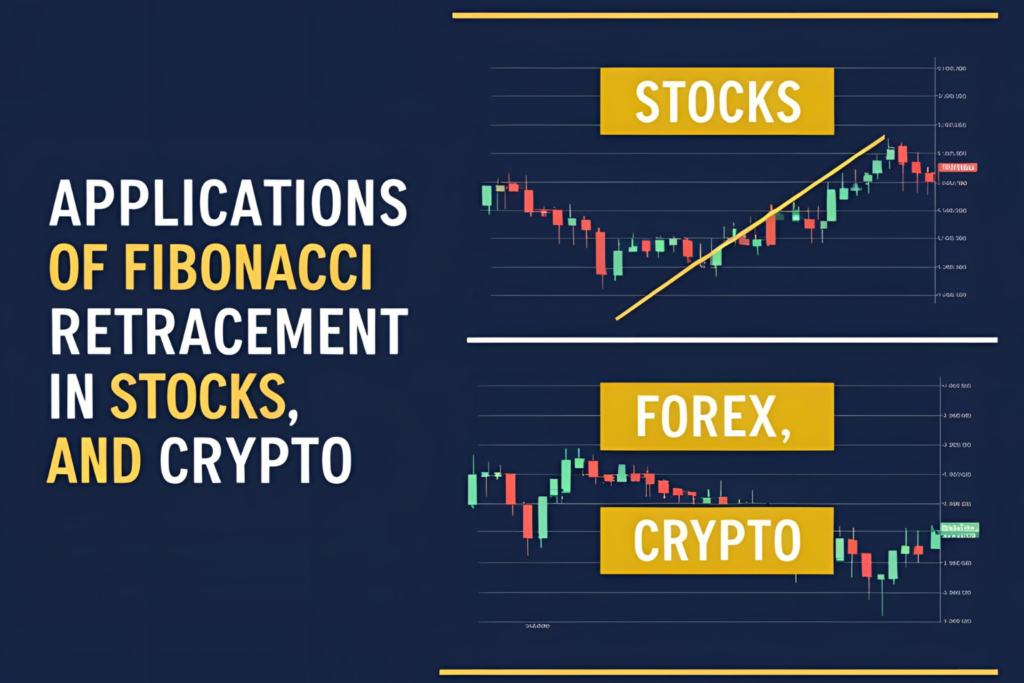
Knowing how to use Fibonacci retracement effectively can transform your trading approach. It adds structure, helps identify high-probability zones, and works across all asset classes when used correctly.
Always pair it with confirmation tools and a clear plan for best results.
✅ FAQs
1. Can I use Fibonacci on any timeframe?
Yes. It works on intraday, daily, weekly, or monthly charts.
2. Is 50% a real Fibonacci level?
Technically no, but it’s commonly used due to its psychological significance.
3. What is the best confirmation tool with Fibonacci?
RSI or candlestick patterns work very well.
4. Should I wait for a candle to close at a level?
Yes. Always wait for confirmation before entering.
5. Does Fibonacci work in sideways markets?
No. It’s most effective in clearly trending markets.