Understanding how Fibonacci retracement works is essential for any trader aiming to identify potential support and resistance levels during price corrections. Unlike predictive indicators, Fibonacci retracement reacts to market structure and provides logical zones where price may pause or reverse.
Let’s explore how this powerful technical tool functions in real-world trading.
The Logic Behind Fibonacci Retracement
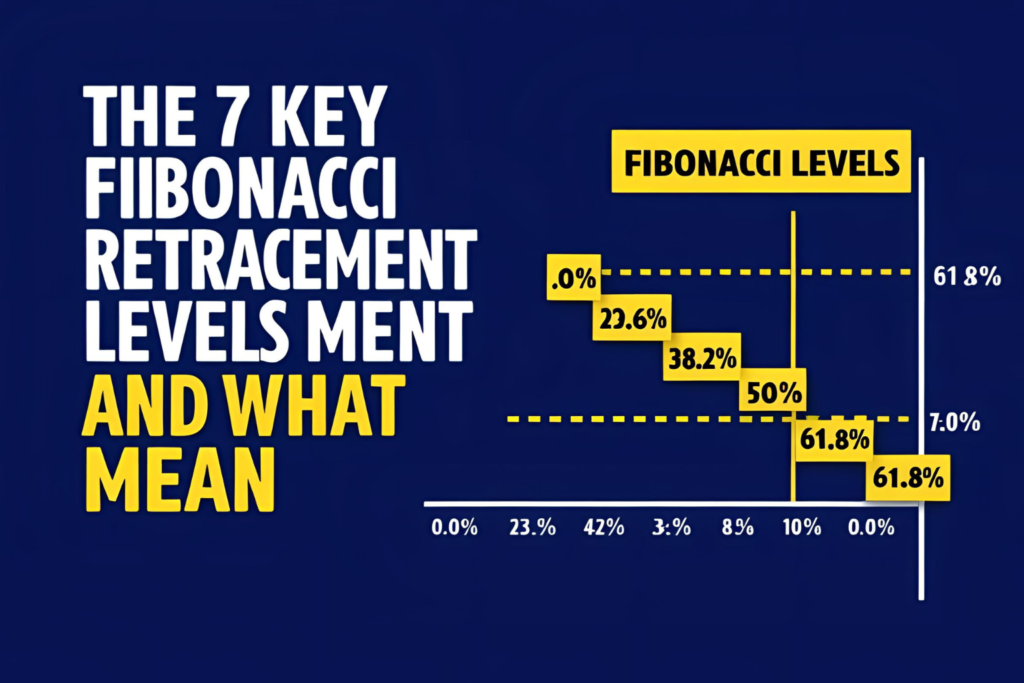
Fibonacci retracement is based on a sequence of numbers that leads to key ratios, most notably 61.8%, 38.2%, and 23.6%. In trading, these ratios help identify retracement levels during a pullback within a trend.
The concept assumes that markets often retrace a predictable portion of a move before continuing in the original direction.
How Does It Work Step-by-Step?
✅ Step 1: Identify the Trend
First, determine whether the market is trending up or down. You’ll need a significant swing high and swing low.
✅ Step 2: Apply the Fibonacci Tool
Use your charting platform to draw the Fibonacci retracement tool:
- In an uptrend: draw from swing low to swing high
- In a downtrend: draw from swing high to swing low
This will automatically generate horizontal lines at key Fibonacci levels.
✅ Step 3: Analyze Price Reaction
Watch how the price behaves at each level:
- 38.2% retracement = healthy correction
- 50.0% retracement = midpoint/psychological
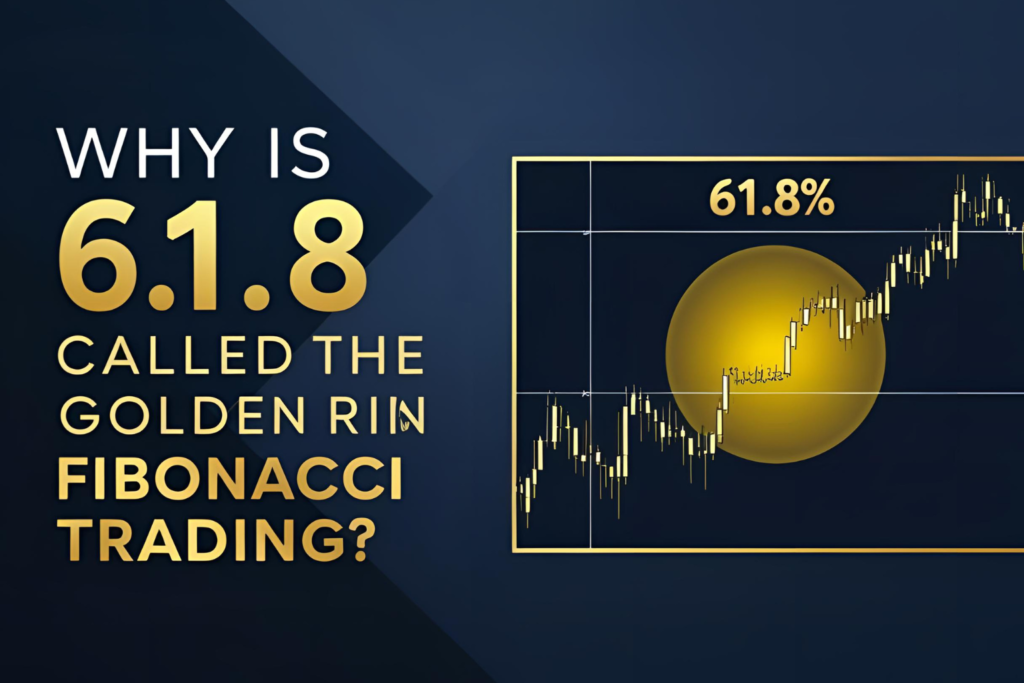
- 61.8% retracement = critical “golden ratio” zone
These levels become potential entry points, stop zones, or targets depending on your trading plan.
Example: Fibonacci Retracement in Action
Let’s say a forex pair rallies from 1.1000 to 1.1500.
- Drawing a Fibonacci retracement on this uptrend gives:
- 38.2% level ≈ 1.1309
- 50.0% level ≈ 1.1250
- 61.8% level ≈ 1.1191
If price pulls back and finds support near 1.1250, a trader might enter long, placing a stop-loss below 1.1191 and aiming to ride the trend continuation.
What Makes Fibonacci Work?
It’s widely used because:
- Many traders watch the same levels (self-fulfilling effect)
- It aligns with natural market behavior (retracements are common)
- It works across all markets: stocks, crypto, forex, and futures
Limitations to Know
- Fibonacci retracement doesn’t predict the direction—it identifies possible levels only
- Should be used with other tools like RSI, MACD, or price action for confirmation
- Can produce false signals in highly volatile or news-driven markets
Final Thoughts
So, how does Fibonacci retracement work? It highlights where a trend might temporarily pause before continuing. By identifying these key levels, traders gain an edge in planning smarter entries, exits, and stop placements.
When combined with proper confirmation, Fibonacci retracement becomes a powerful component in any trading strategy.
✅ FAQs
1. Does Fibonacci retracement work in all timeframes?
Yes, it works on intraday, daily, weekly, and monthly charts.
2. Do all traders use the same Fibonacci levels?
Most traders focus on 38.2%, 50%, and 61.8%.
3. Should I trade solely using Fibonacci retracement?
No. Always combine it with other tools or indicators for better confirmation.
4. Why does price react to Fibonacci levels?
Because many traders and algorithms watch these levels, creating natural supply and demand zones.
5. Is Fibonacci retracement reliable in sideways markets?
Not as much. It works best in trending conditions with clear swings.