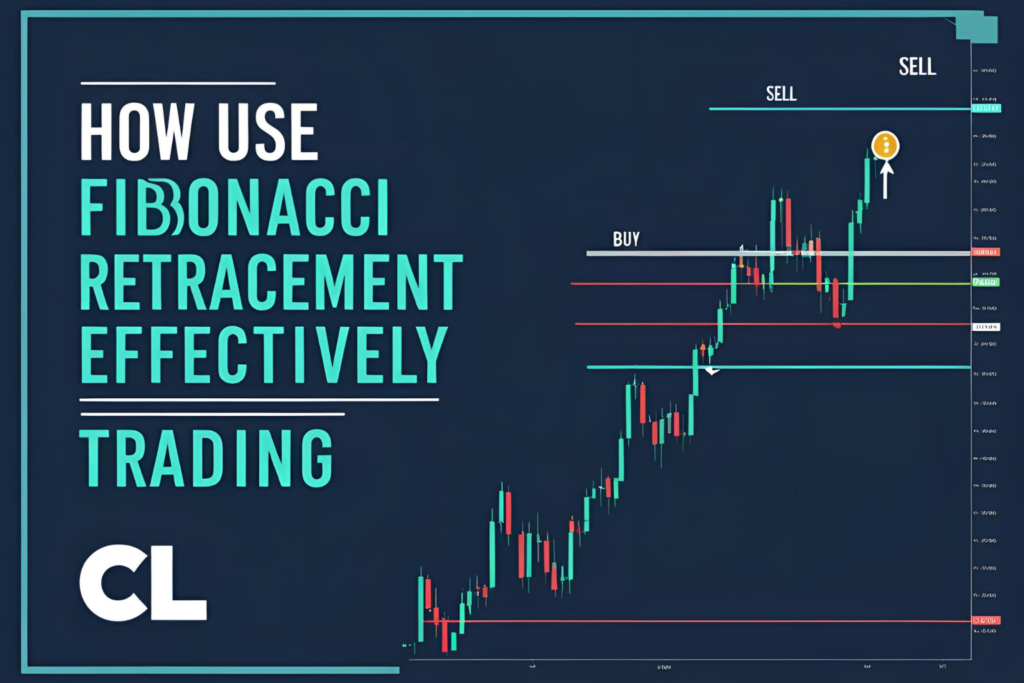
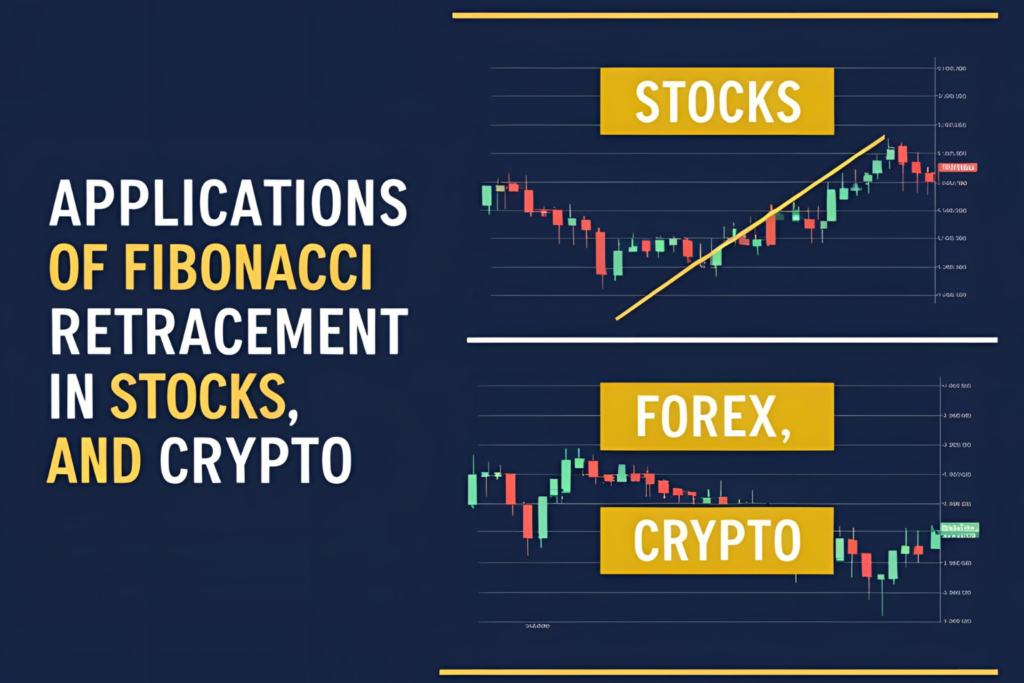
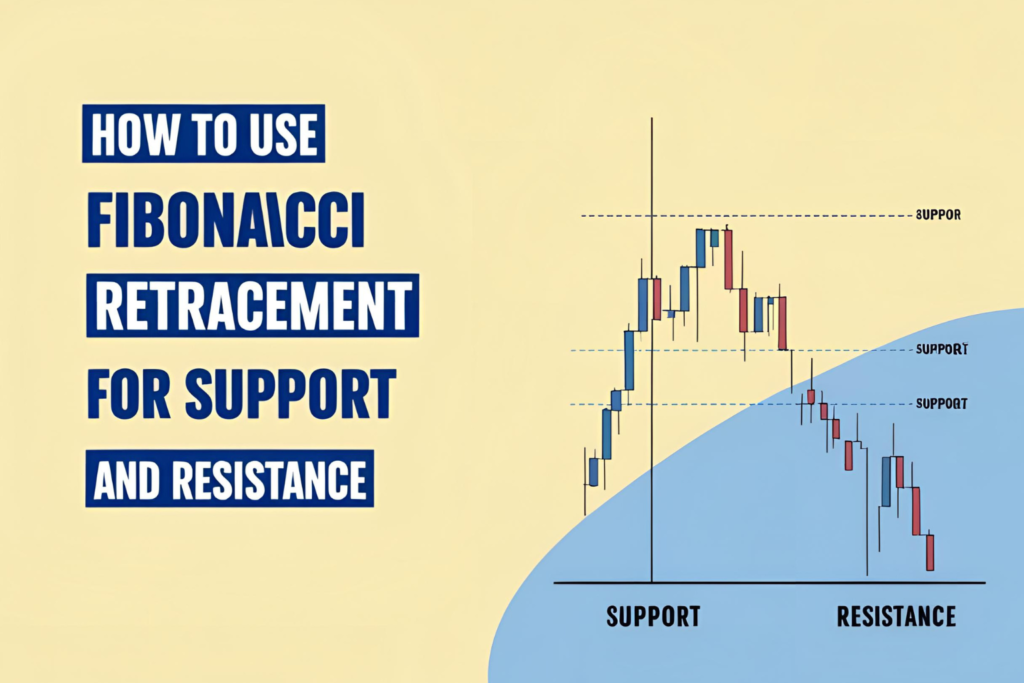
One of the most talked-about concepts in technical trading is the Fibonacci golden zone—a high-probability area where price often reacts during retracements. It typically includes the 38.2% to 61.8% retracement levels, with extra focus on the 61.8% golden ratio.
In this post, you’ll learn what the Fibonacci golden zone is and how to use it to plan better entries and exits.
What Is the Fibonacci Golden Zone?
The Fibonacci golden zone refers to the area between the 38.2% and 61.8% retracement levels on a price chart. It is considered the most reliable range for identifying pullbacks in trending markets.
Why? Because:
- Shallow pullbacks (23.6%) often lack strength
- Deep pullbacks (78.6% or more) risk full trend reversal
- The golden zone strikes a balance—deep enough to attract buyers/sellers, but shallow enough to respect the trend
Why It Works
- Psychological levels: Many traders and institutions watch this zone
- Market memory: These levels often align with past support/resistance
- Volatility filter: Helps avoid false breakouts or weak retracements
✅ How to Use the Fibonacci Golden Zone
1. Draw the Fibonacci Retracement Tool
- In an uptrend: from swing low to swing high
- In a downtrend: from swing high to swing low
2. Mark the Golden Zone Range
- Highlight the area between 38.2% and 61.8%
- Some traders also include 50% and 78.6% for flexibility
3. Watch for Entry Signals
Look for entry confirmation inside the zone using:
- Bullish/bearish candlestick patterns
- RSI oversold/overbought signals
- Volume spikes
- Divergence setups
4. Set Your Stop-Loss
- Just below the golden zone (e.g., under 61.8% or 78.6%)
- Ensures protection if trend fails
5. Define Profit Targets
- Use recent highs/lows
- Use Fibonacci extensions like 127.2% or 161.8%
Example
If price moves from $100 to $150, the golden zone spans:
- 38.2% = $130.90
- 50.0% = $125.00
- 61.8% = $119.10
If price retraces into this zone, and bullish confirmation appears around $121, it may be a buy signal with stops just below $118 and targets near $145–$155.
Final Thoughts
The Fibonacci golden zone is not a guarantee, but it’s one of the most effective areas to watch for trade setups. When used with confirmation tools and proper risk management, it provides high-probability entry and exit opportunities in trending markets.
✅ FAQs
1. What are the exact golden zone levels?
38.2% to 61.8%, often including the 50% midpoint.
2. Does the golden zone work in all markets?
Yes. It’s used in forex, stocks, crypto, futures, and more.
3. Should I always buy at 61.8%?
No. Wait for confirmation such as price rejection or momentum shift.
4. Can I use this for short trades?
Yes. In downtrends, look for entry around the golden zone after retracements.
5. What if price breaks below 61.8%?
It could mean deeper retracement toward 78.6% or a possible trend reversal.


