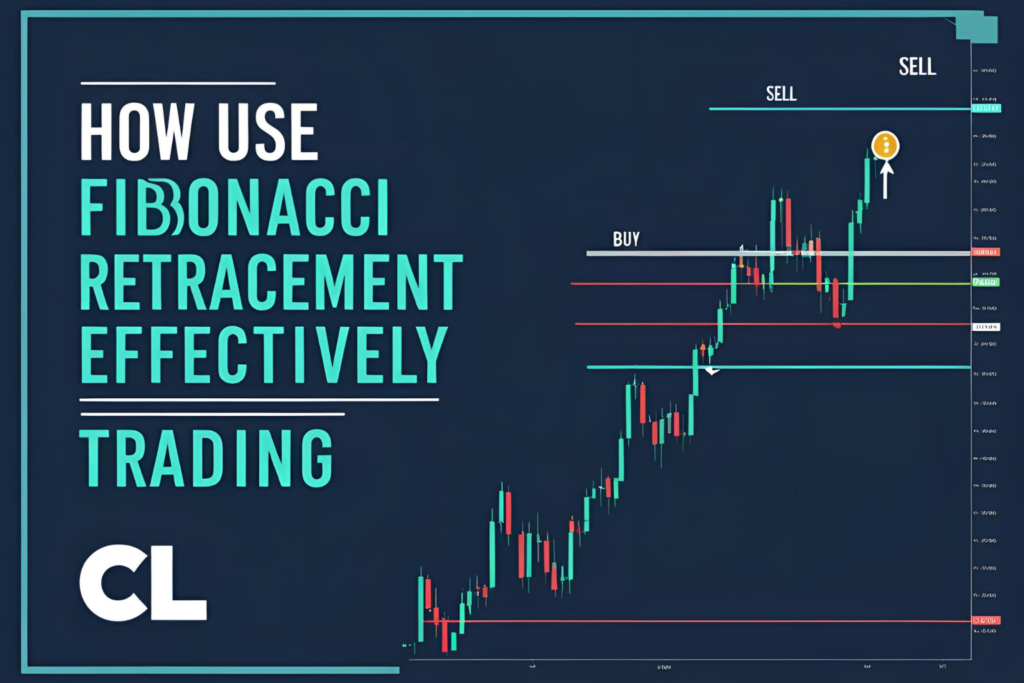
Support and resistance levels are essential in technical analysis. When combined with Fibonacci retracement, they become even more powerful. Traders often use this tool to identify key zones where price may bounce or reverse, offering high-probability trade setups.
In this guide, we’ll explain how to use Fibonacci retracement for support and resistance—with practical tips for reliable entries and exits.
What Is Support and Resistance?
- Support is a price level where demand is strong enough to stop a decline.
- Resistance is where selling pressure halts an upward move.
These levels often repeat over time, forming the basis of trading zones.
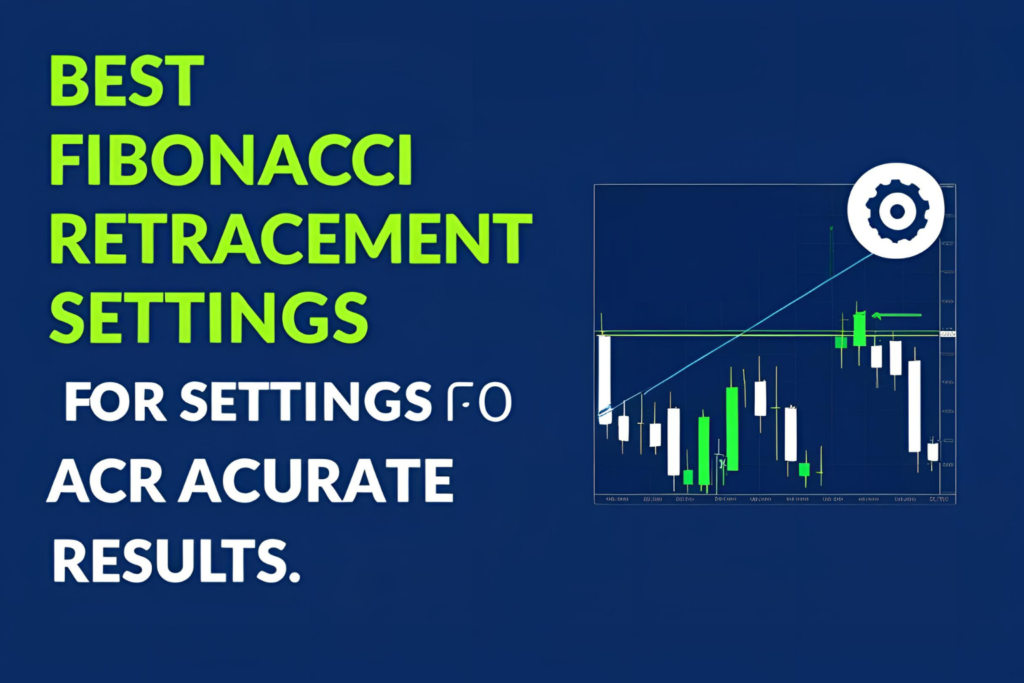
How Fibonacci Helps Identify These Levels
Fibonacci retracement draws horizontal levels based on the size of a prior price move. These lines often overlap with historical support or resistance, reinforcing their importance.
Key retracement levels used:
- 38.2% – minor pullback support/resistance
- 50.0% – neutral midpoint
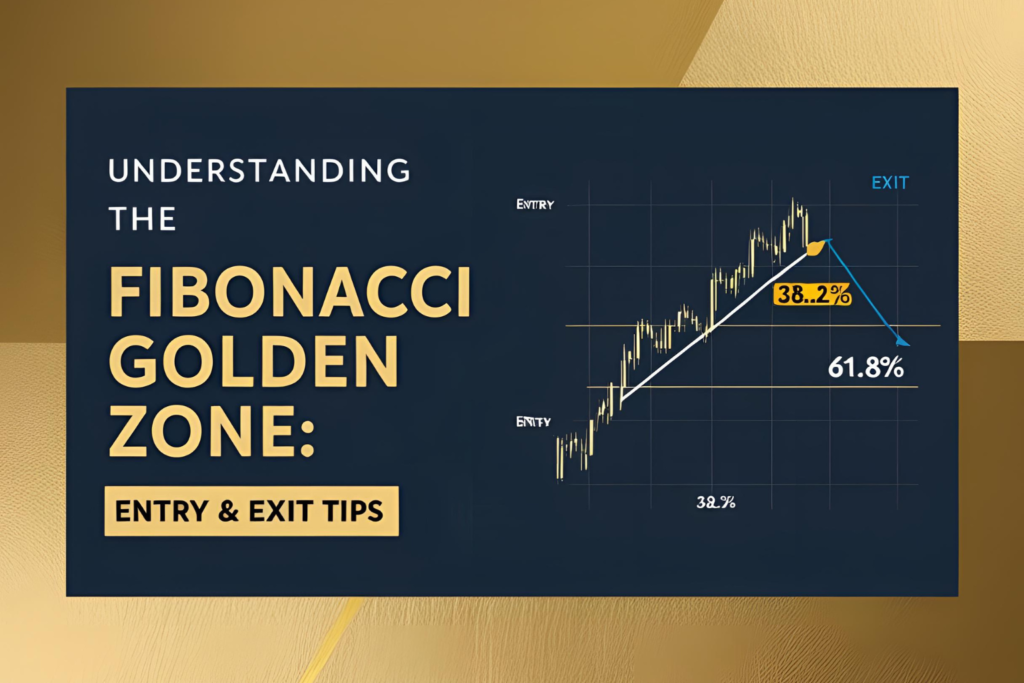
- 61.8% – golden ratio and key reversal level
- 78.6% – deep pullback, final support/resistance
✅ Step-by-Step: Using Fibonacci for S&R
1. Identify the Trend
- Uptrend → draw from swing low to high
- Downtrend → draw from swing high to low
2. Apply Fibonacci Tool
Let the tool plot levels between 0% and 100% of the move.
3. Watch for Confluence
If a Fibonacci level aligns with:
- A previous high or low
- A moving average
- A psychological price (e.g., round number)
…it becomes a stronger support or resistance zone.
4. Enter Trades With Confirmation
Look for:
- Candlestick patterns (e.g., hammer, shooting star)
- Volume spikes
- Momentum indicators (e.g., RSI, MACD)
5. Set Stops and Targets
- Stops: Below the retracement level (for long) or above (for short)
- Targets: Use next Fibonacci level or previous swing highs/lows
Example
If price moves from $100 to $150:
- 61.8% retracement = $119.10
- If price pulls back to $119 and bounces with strong volume, that level becomes support
- Traders may enter long, expecting a retest of $145–$150 resistance
Final Thoughts
Using Fibonacci retracement for support and resistance gives traders a structured approach to finding entry zones, exit points, and risk control. These levels act like magnets—where price pauses, reverses, or accelerates.
To boost accuracy, always combine Fibonacci levels with trend analysis and confirmation signals.
✅ FAQs
1. Can Fibonacci levels replace trendlines?
No. They complement trendlines but don’t replace them.
2. Do all Fibonacci levels act as support or resistance?
Not always. Look for confirmation and price reaction before acting.
3. Which level is most reliable?
The 61.8% golden ratio is the most respected among traders.
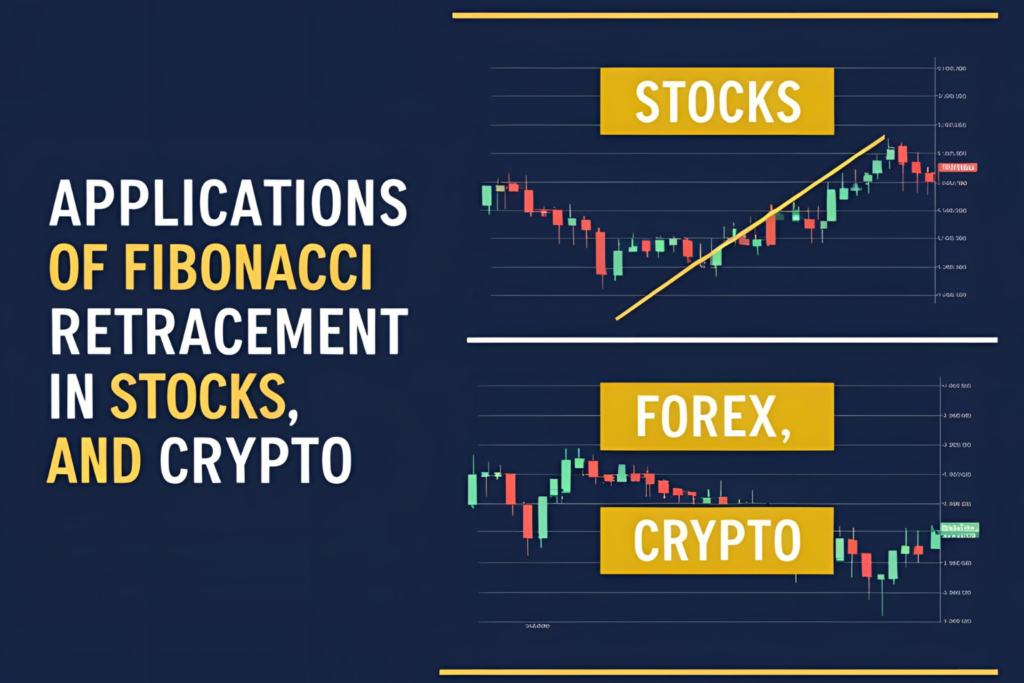
4. Can I use Fibonacci on sideways markets?
It’s best used in trending markets with clear swing highs and lows.
5. Does it work better on certain timeframes?
Fibonacci levels work on all timeframes, but are most reliable on 1H and higher.